Dashboard · Rootcraft, included for every agency

Every client at a glance.

One place to see every client: what’s serious, what’s open, what’s been confirmed fixed and what’s been spent. Add Reeva and ask about any of it without leaving the page. Your team can work from chat or the dashboard, whichever suits them.
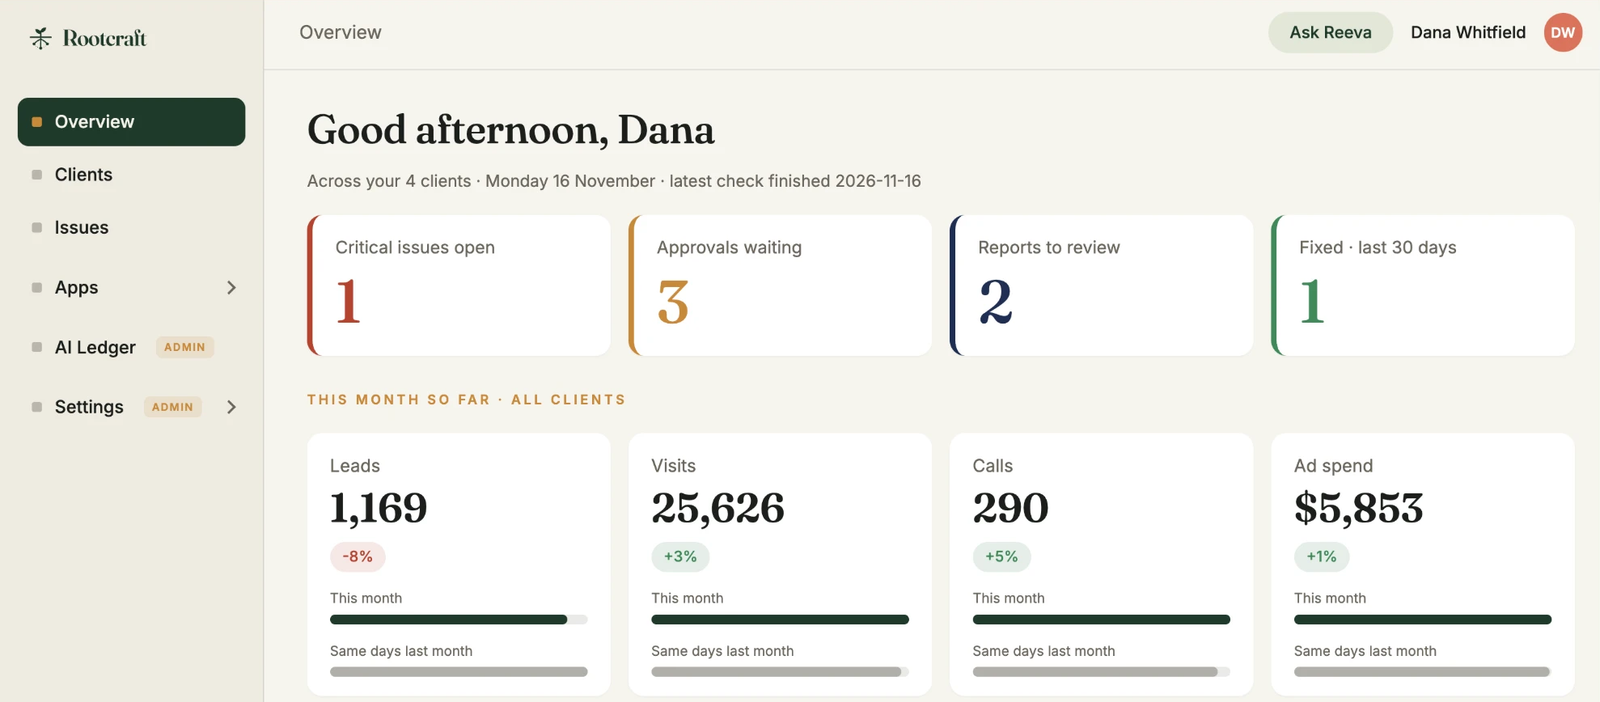
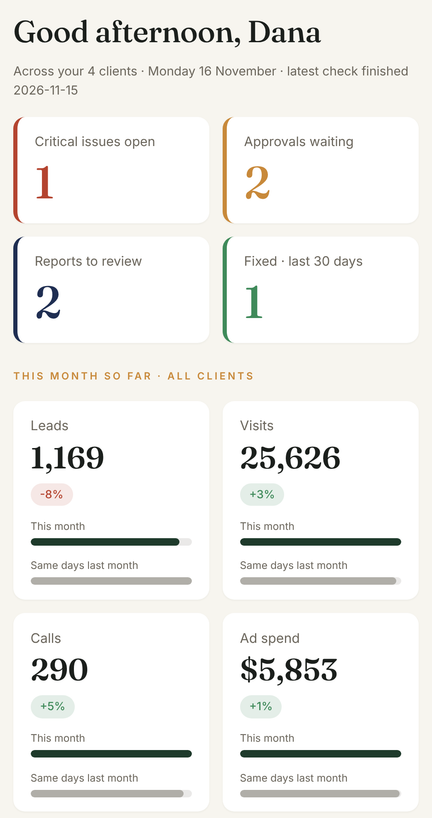
The Rootcraft dashboard overview for Northwind Digital (demo), a sample agency: a greeting for Dana with an Ask Reeva button at the top; four counts (1 critical issue open, 3 approvals waiting, 2 reports to review, 1 fixed in the last 30 days); then this month so far across all clients, each against the same days last month: 1,169 leads (−8%), 25,626 visits (+3%), 290 calls (+5%) and $5,853 ad spend (+1%).The Rootcraft dashboard overview for Northwind Digital (demo), a sample agency: a greeting for Dana with an Ask Reeva button at the top; four counts (1 critical issue open, 3 approvals waiting, 2 reports to review, 1 fixed in the last 30 days); then this month so far across all clients, each against the same days last month: 1,169 leads (−8%), 25,626 visits (+3%), 290 calls (+5%) and $5,853 ad spend (+1%).

What Dashboard does

  • Reeva, if you add her

    Ask about any client right from the dashboard, the same way you would in Slack, as yourself and with the same permissions.

  • Every client at a glance

    Serious issues, approvals and reports waiting, confirmed fixes, and this month’s leads, visits, calls and ad spend against last month, for every client on one page.

  • Each client’s page

    Issues, fixes, Google Ads by location, reports and a record of what happened, all in one place.

  • Reports and activity

    Which reports are waiting for approval, and what’s happened across the agency recently.

  • Built for locations

    Clients with several offices get each one tracked on its own, with its own Ads campaigns, Business Profile and call-tracking number.

  • AI and tools spend, per client

    For owners and admins: what your AI and tools cost, read daily from your agency’s own AI accounts, and what each client costs to serve. Reeva can show it in Slack too.

  • How often it runs

    Updated as each check runs, through the day.

Every client, at a glance.

What’s serious, what’s waiting on your team, what’s been confirmed fixed, and every open issue in one place. Shown here on a sample agency.
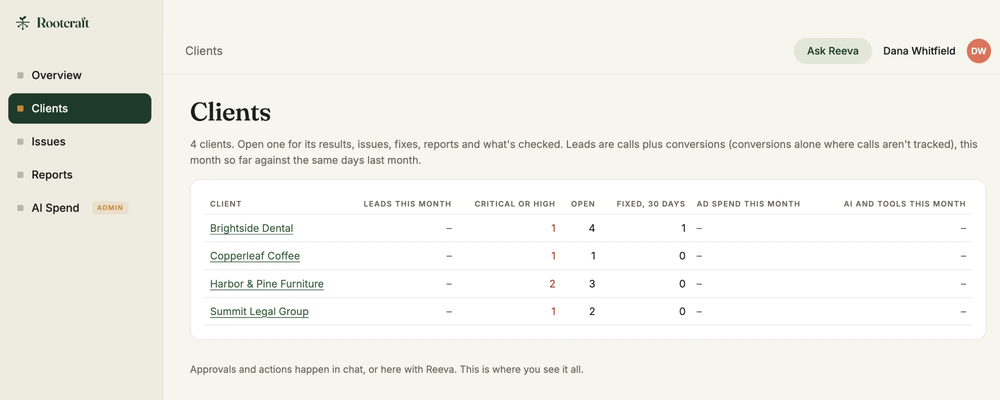
The Clients page of the dashboard: four sample clients in one table, each with its leads this month, critical or high issues, open issues, issues confirmed fixed in the last 30 days, ad spend and AI and tools spend this month.
Every client in one table: leads, serious issues, open issues, confirmed fixes and spend.
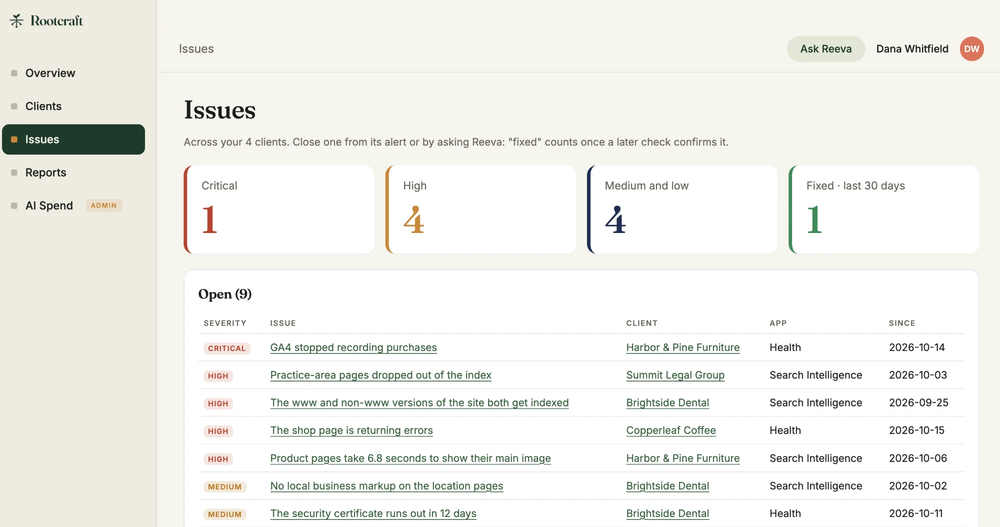
The Issues page of the dashboard across four sample clients: 1 critical, 4 high, 4 medium and low, and 1 fixed in the last 30 days, then a table of open issues with severity, the client, the app that found each and when, such as GA4 no longer recording purchases for Harbor & Pine Furniture.
Every open issue across your clients, which app found it, and since when.

See it on your own clients.

Start your free trial